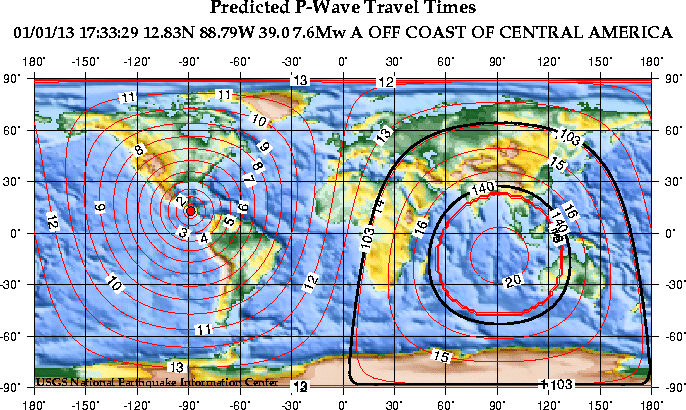
This map shows the predicted (theoretical) travel times, in minutes, of the compressional (P) wave from the earthquake location to points around the globe. The travel times are computed using the spherically-symmetric IASP91 reference earth velocity model. The heavy black lines shown are the approximate distances to the P-wave shadow zone (103 to 140 degrees).
| City | Distance (degrees) |
Travel Time (min:secs) |
Arrival Time UTC |
Phase |
|---|---|---|---|---|
| Mexico City, Mexico | 11.93 | 2:47.4 | 17:36:16.4 | Pn |
| San Juan, Puerto Rico | 22.52 | 4:56.2 | 17:38:25.2 | P |
| Lima, Peru | 27.37 | 5:41.4 | 17:39:10.4 | P |
| Golden, Colorado | 30.47 | 6:09.0 | 17:39:38.0 | P |
| Ottawa, Canada | 34.33 | 6:42.7 | 17:40:11.7 | P |
| Anchorage, Alaska | 65.09 | 10:36.6 | 17:44:05.6 | P |
| London, England | 79.23 | 12:01.1 | 17:45:30.1 | P |
| Bergen, Norway | 80.99 | 12:10.6 | 17:45:39.6 | P |
| Palmer Station, Antarctica | 82.35 | 12:17.8 | 17:45:46.8 | P |
| Rome, Italy | 89.76 | 12:54.2 | 17:46:23.2 | P |
| Moscow, Russia | 98.40 | 13:33.6 | 17:47:02.6 | Pdiff |
| Wellington, New Zealand | 103.14 | 13:54.6 | 17:47:23.6 | Pdiff |
| Tokyo, Japan | 113.44 | 14:40.4 | 17:48:09.4 | Pdiff |
| Agana, Guam | 120.85 | 15:13.3 | 17:48:42.3 | Pdiff |
| Beijing, China | 122.53 | 15:20.7 | 17:48:49.7 | Pdiff |
| Nairobi, Kenya | 124.95 | 15:31.5 | 17:49:00.5 | Pdiff |
| Kathmandu, Nepal | 139.31 | 16:35.2 | 17:50:04.2 | Pdiff |
На основную страницу Список землетрясений
URL: http://zeus.wdcb.ru/wdcb/sep/strong/20010113/times.htmlLast revision January 26, 2001